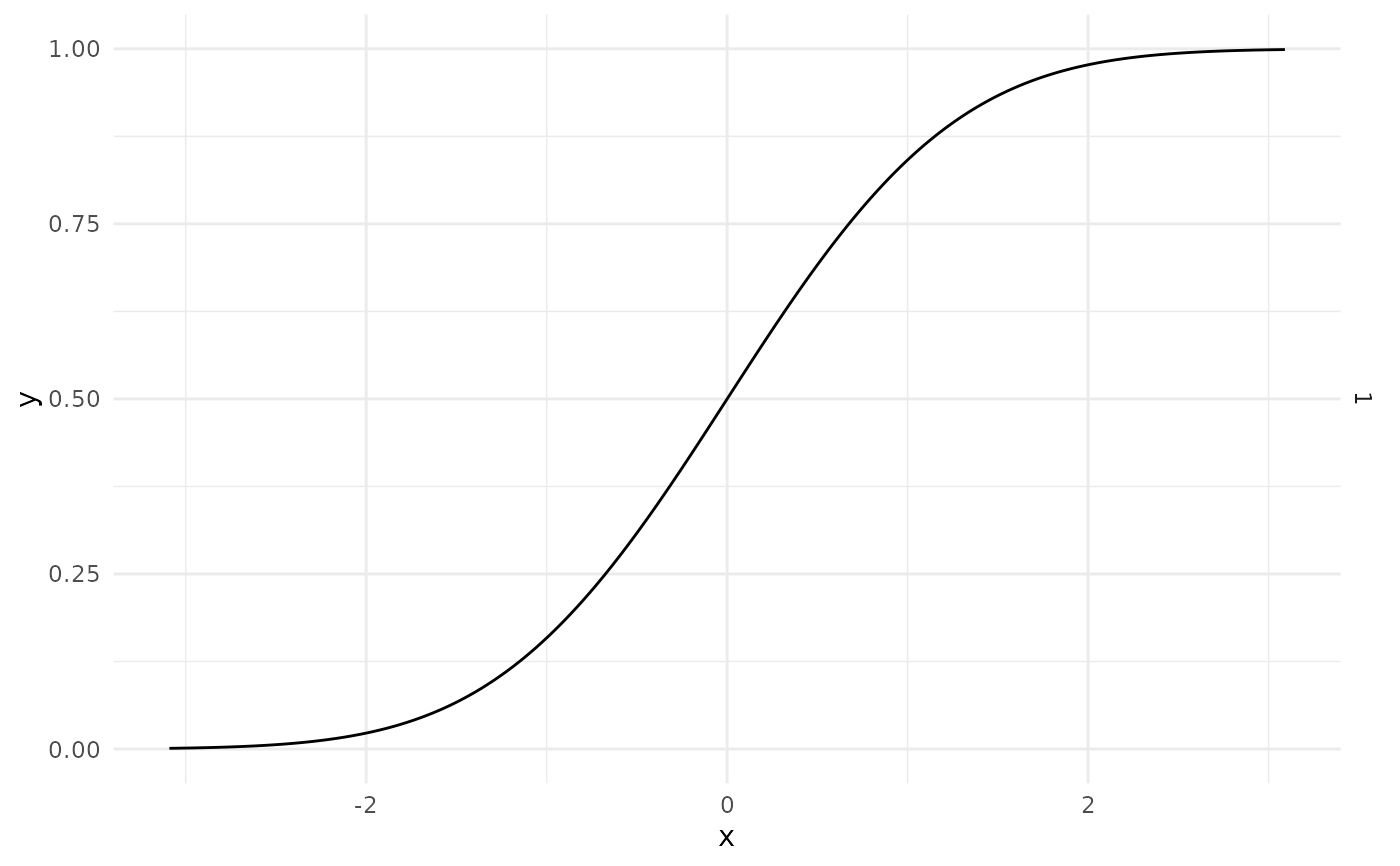
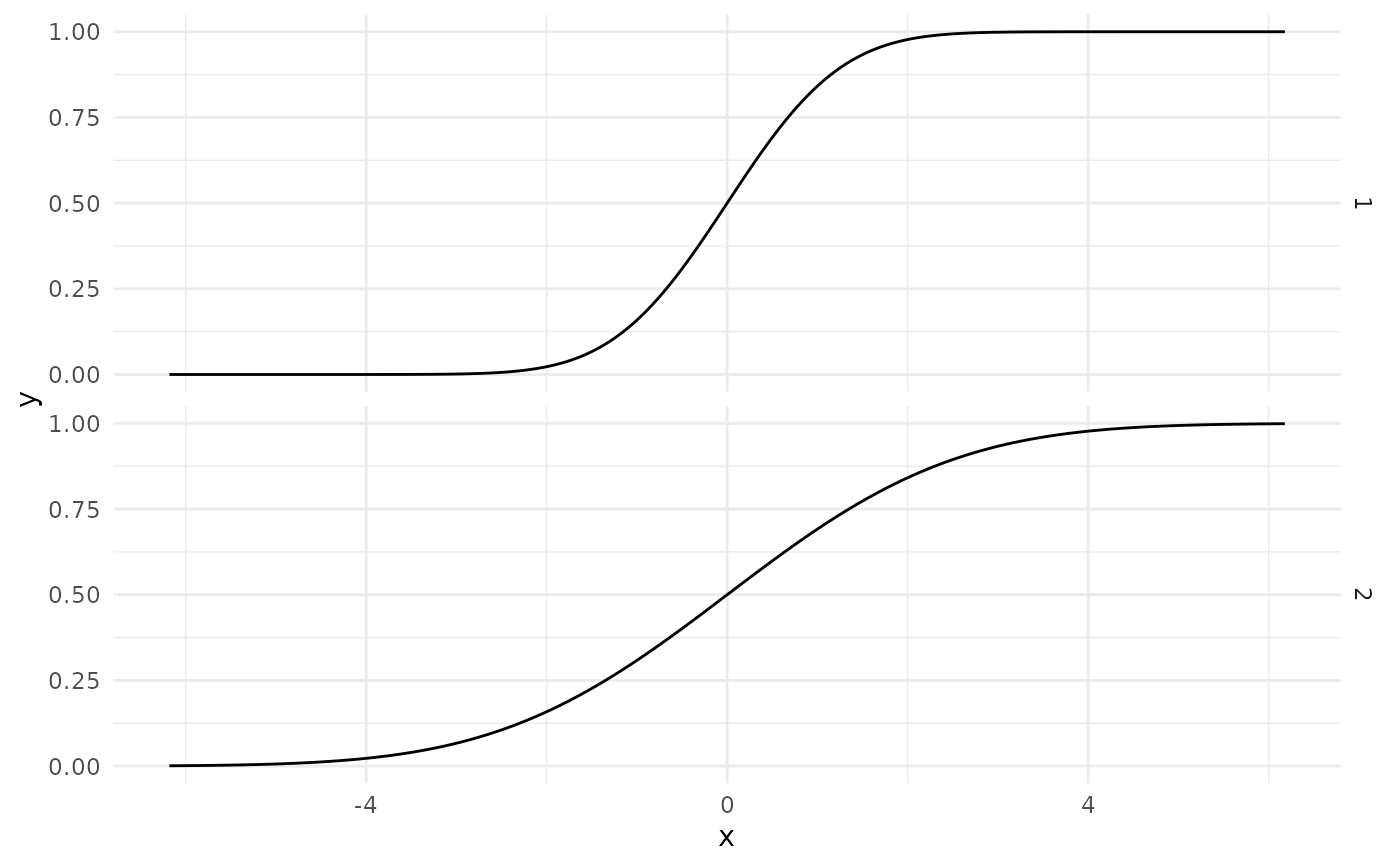
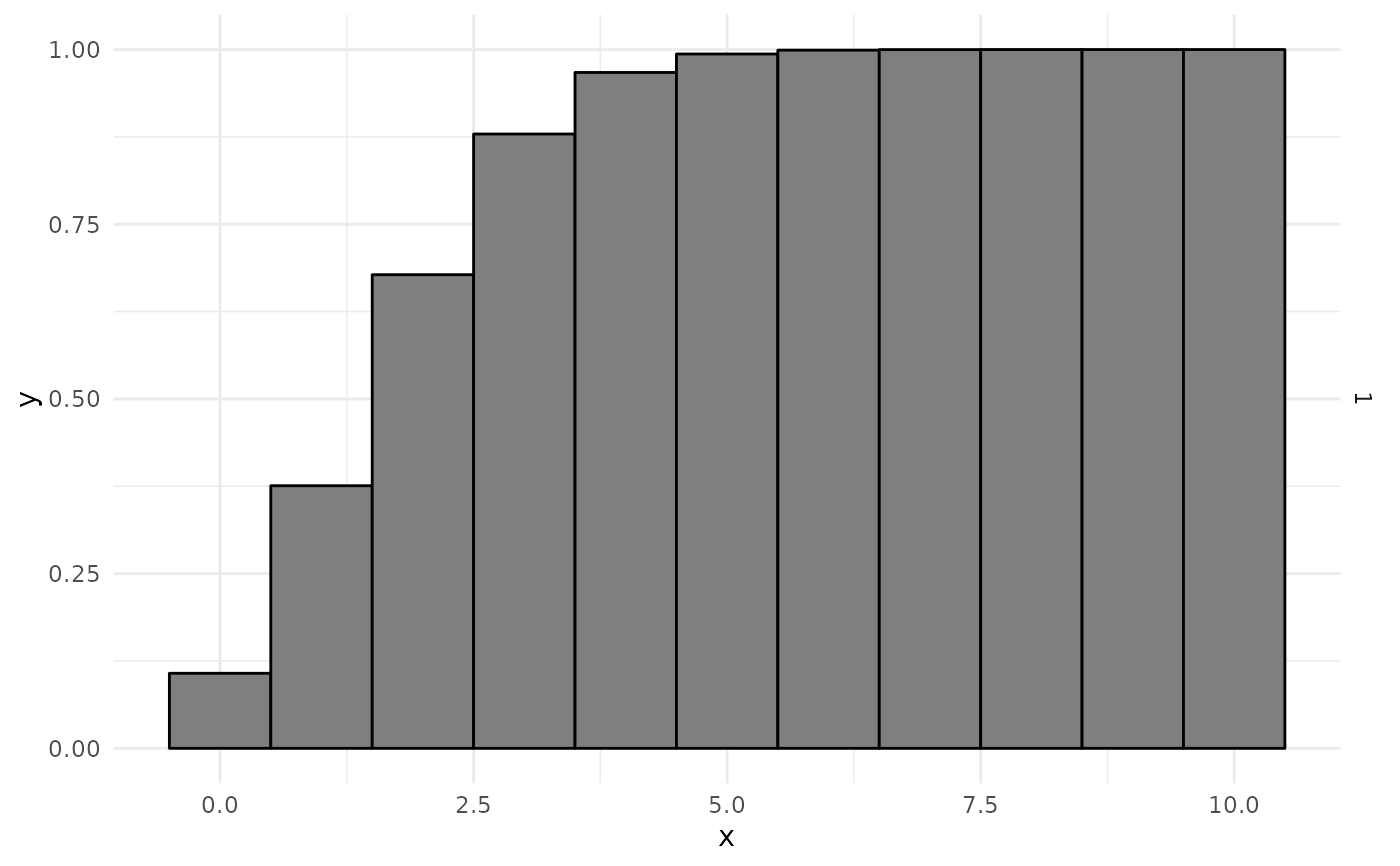
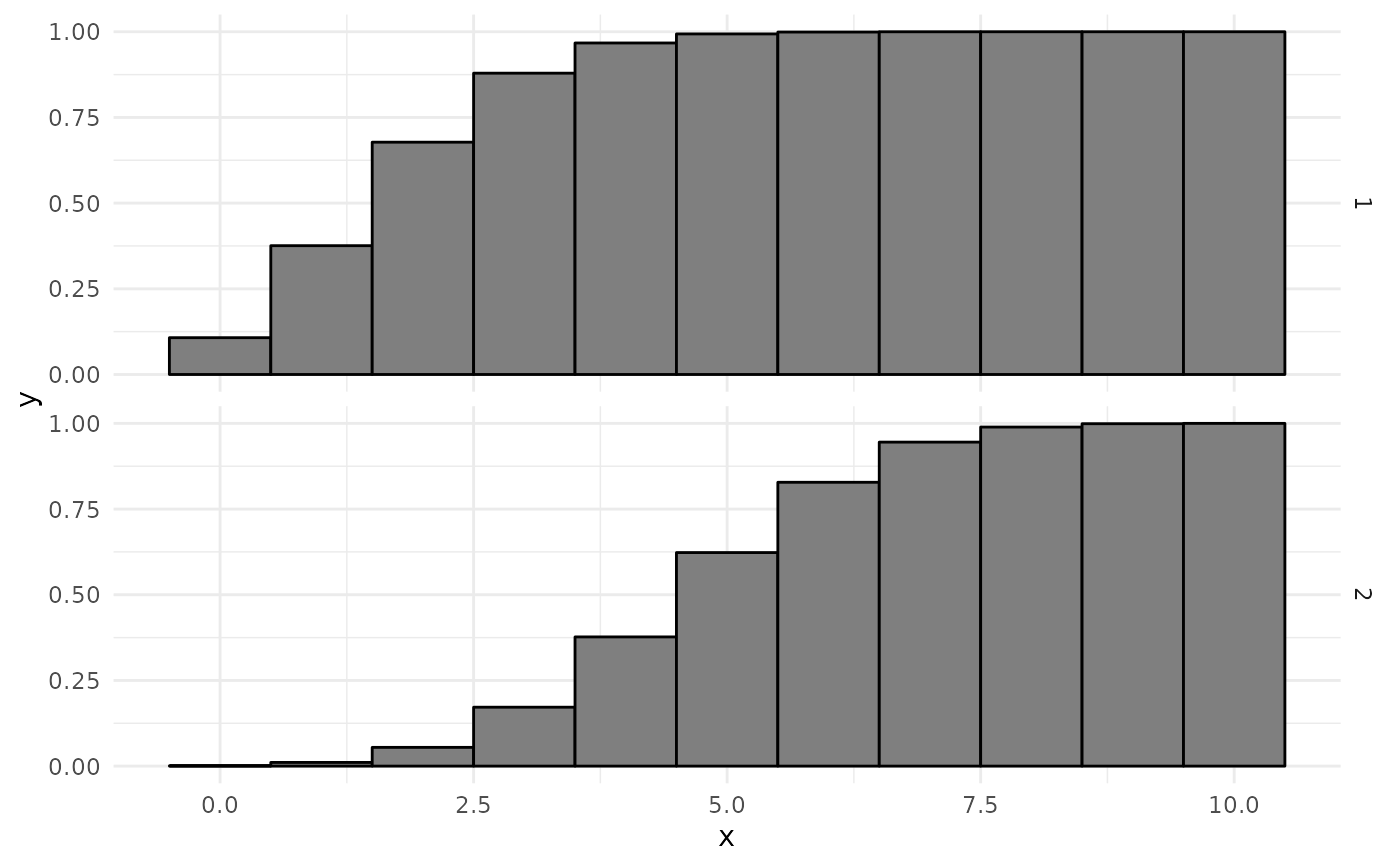
A function to easily plot the CDF of a distribution using ggplot2. Requires ggplot2 to be loaded.
Arguments
- d
A
distributionobject- limits
either
NULL(default) or a vector of length 2 that specifies the range of the x-axis- p
If
limitsisNULL, the range of the x-axis will be the support ofdif this is a bounded interval, orquantile(d, p)andquantile(d, 1 - p)if lower and/or upper limits of the support is-Inf/Inf. Defaults to 0.001.- plot_theme
specify theme of resulting plot using
ggplot2. Default istheme_minimal